Reevaluating the way your team creates and delivers QBRs? QBRs should be data-driven and should tell a compelling story, but getting all of the data you need and starting from scratch can be a challenge. To help you out, this QBR kit includes several resources that will help you fine-tune your strategy, whether you’re creating a full, multi-slide QBR presentation or a concise QBR one-pager.
Your copy is on the way to your email!
Oops! Something went wrong while submitting the form.
01
Introduction
To kick things off, let’s start by evaluating your current QBR to see how it can be improved. As you may know, quarterly business reviews are all about showing your customer the progress they’ve made with your product, and should revisit all the goals they had when they started. It’s your responsibility to show the customer how far they’ve come by sharing a data-driven narrative that is thorough, yet easy to understand.
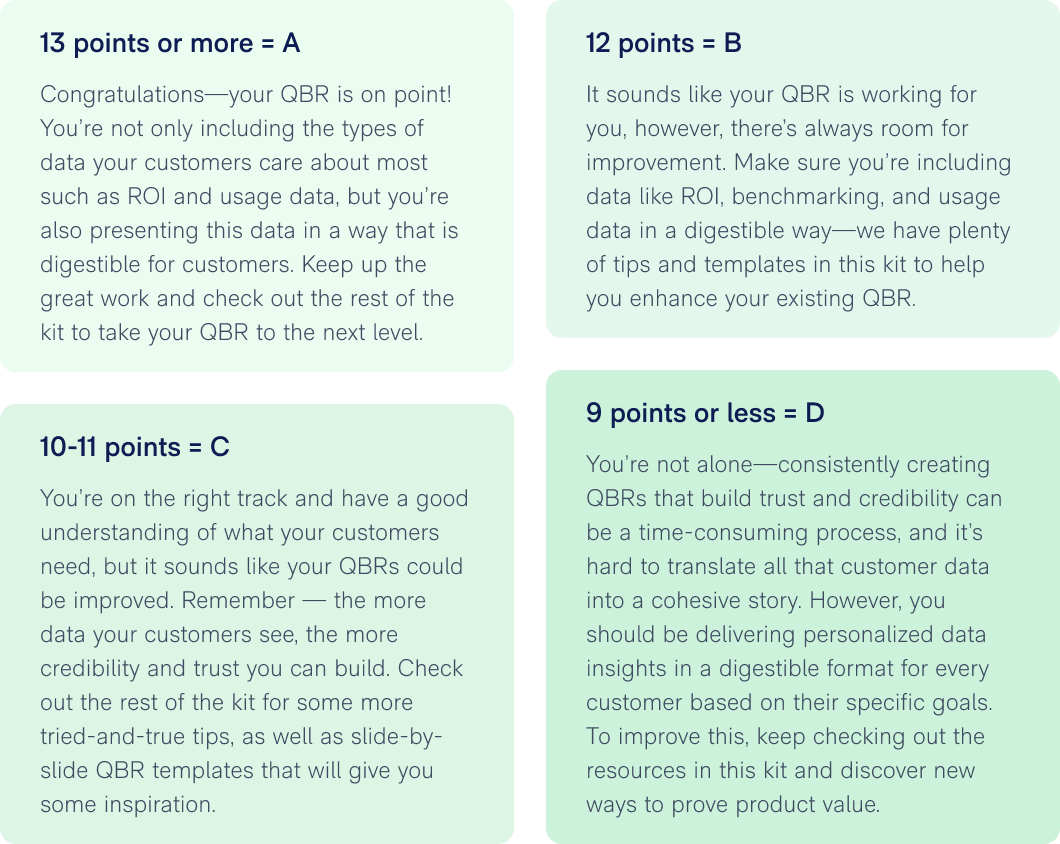
So, how does your QBR stack up, and where can it be improved? Take our quiz here, note your score at the end, read your results and feedback below, then check out the rest of the kit to discover actionable QBR tips & best practices.
02
How to Create Engaging QBRs
QBRs may feel daunting — while they are great opportunities for showing the value of your product, they also play an important role in your customer’s decision to renew your services. For this reason, it’s critical to deliver engaging QBRs that tell an undeniable story about the role your product plays in the success of your customer’s business.
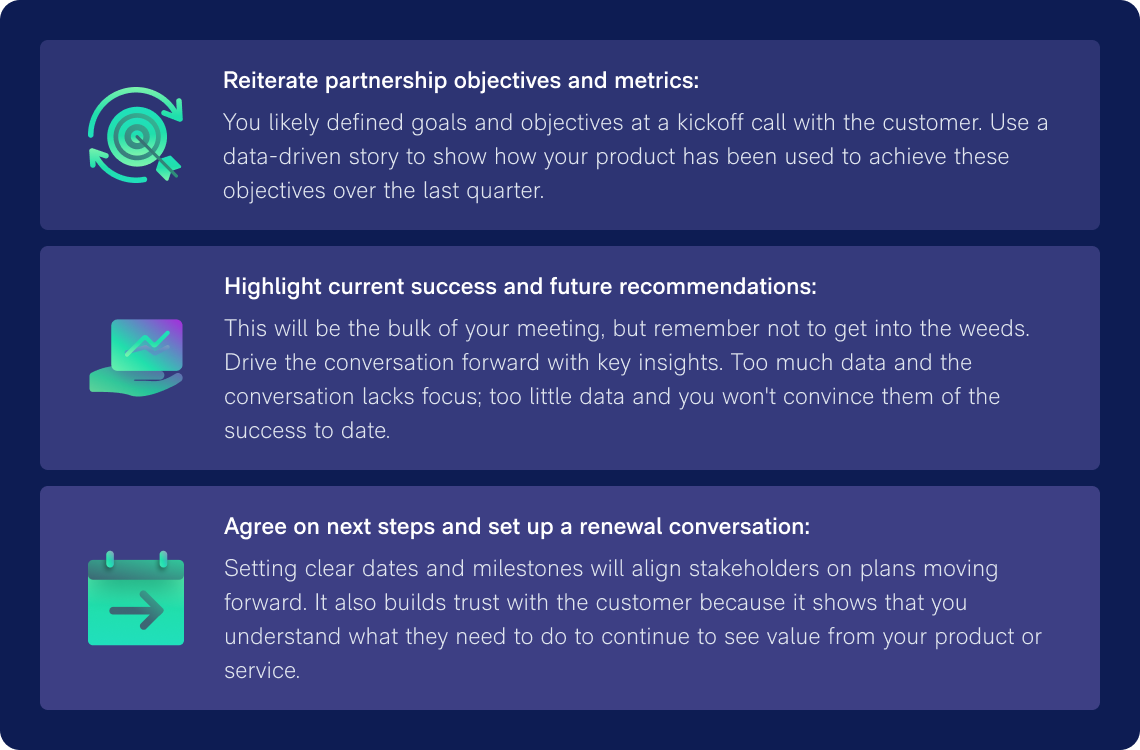
The key to a winning QBR is using data to tell this story and guide your customer to a renewal. Here are three key things to keep in mind when creating a data-driven QBR:
Learn more about how to structure engaging QBRs in this blog post, then read on to the next resource in this kit to discover some common QBR mistakes to avoid.
03
Common QBR Mistakes and How to Avoid Them
In order to improve the QBR process overall, it’s important to think from your customer’s perspective and share the data they care about most, while streamlining the process for internal teams. Improving the QBR process can contribute to other benefits, including boosted retention, reduced churn rates, and greater customer trust. To work toward making QBRs better for everyone involved, keep an eye out for these common mistakes:
Lack of proof
In a QBR, customers need to see proof that a product is helping them work toward their goals. Particularly in times of economic uncertainty, companies are evaluating their tech stacks to determine which software is business-critical and which software can be eliminated. With this in mind, shorting your customers on the data they need is a huge QBR mistake.
Complexity
As we’ve covered, it’s important to present numerous data points during a QBR in order to prove the value of your product. However, it’s equally important to avoid sharing obscure, overly complex data that forces the customer to come to their own conclusions. A QBR presentation (and really any piece of data-driven content) needs to be compelling, shareable, and concise. Consider using data visualizations like charts, tables, and graphs to make data more digestible.
Failing to involve the right people
Key stakeholders need to have visibility into the data and overall process, or else your messages won’t be received. Work with your account contacts to make sure the right individuals with influence over purchase decisions are involved in some way.
Inconsistency
A quarterly business review should, of course, happen every quarter. However, some teams struggle to keep up with this frequency for all of their accounts. To ensure that your QBRs are as effective as possible, they need to be happening for every customer on a regular basis.
Check out this blog post for more common QBR mistakes to avoid. Now that you know how to make your QBRs more engaging and which mistakes to avoid, keep reading to check out our templates — these templates will provide a step-by-step walkthrough of what to include in your QBR, and what a successful QBR should look like.
04
Template: The Essential QBR
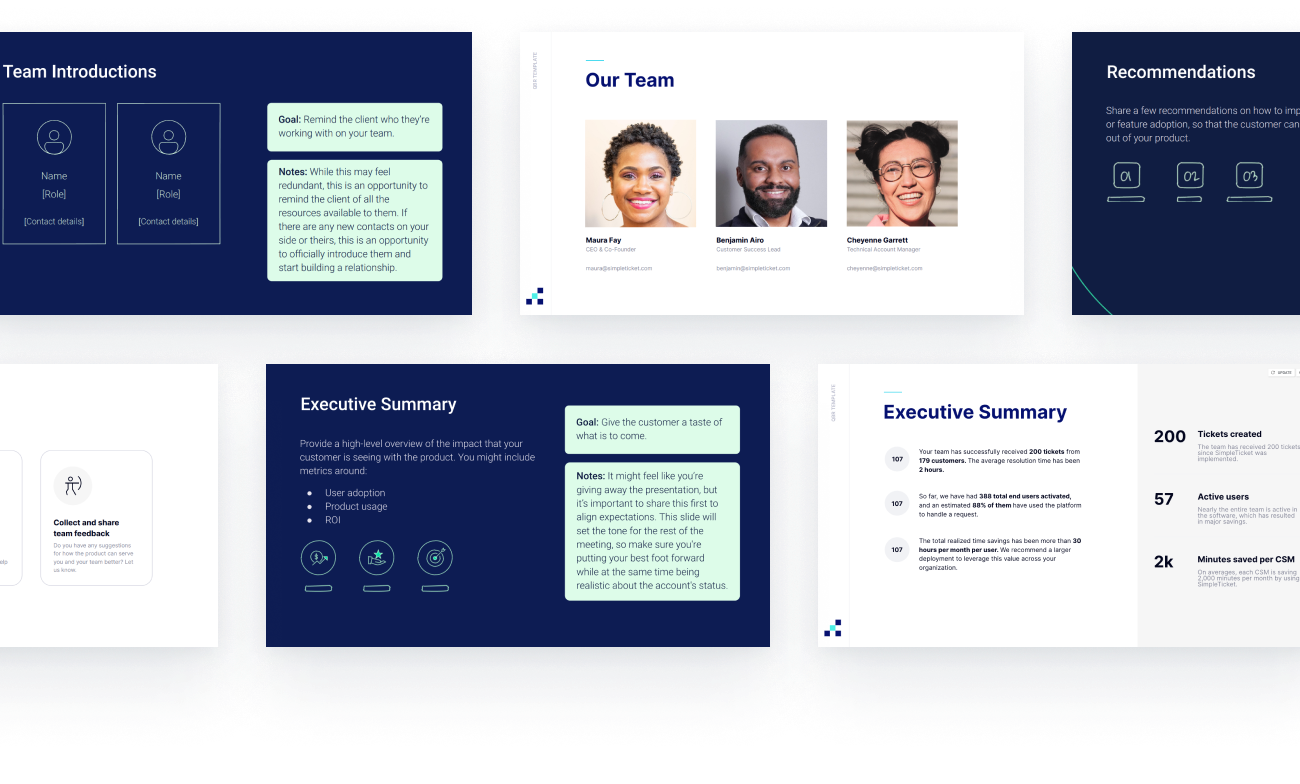
QBRs can be time-consuming to create. Not only do CSMs have to sift through data, but they also have to design the presentations. QBRs need to be visually attractive, digestible, and informative in order to be effective—and creating a new presentation each quarter for each account simply isn’t sustainable. If you need an easier way to build QBRs, check out our Essential QBR Template and use it as a guide for your next QBR.
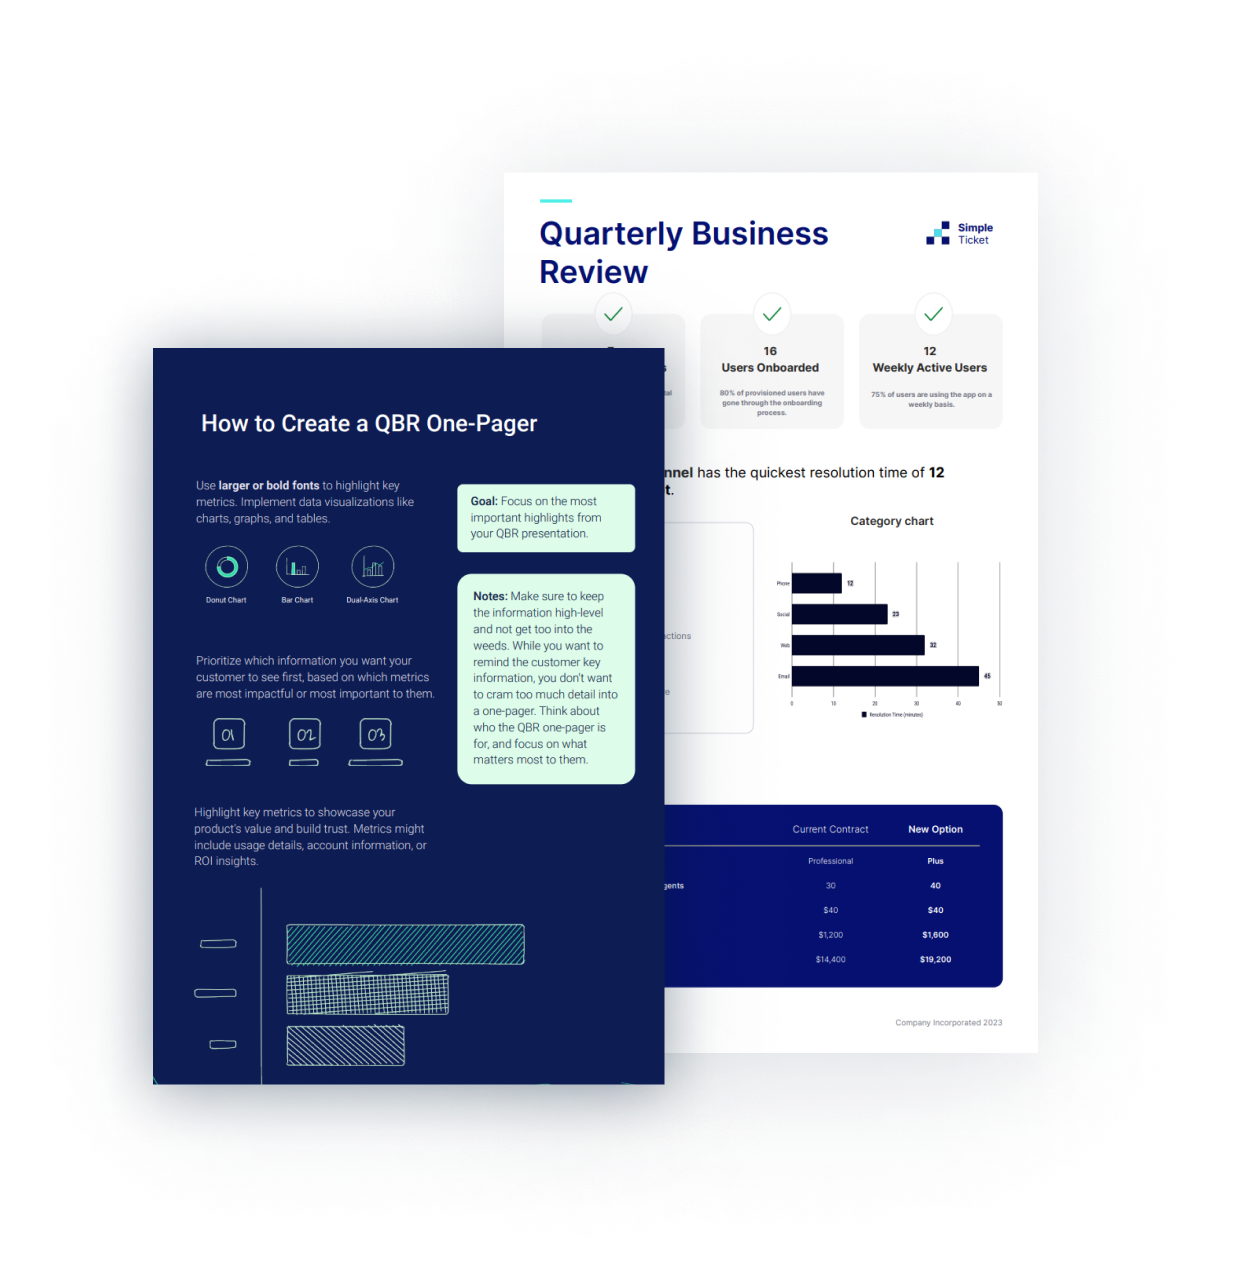
A QBR one-pager is a brief, at-a-glance, yet data-driven resource that can be used by customer success teams to summarize key insights from a quarterly business review. In contrast with a full QBR presentation, a one-pager includes only the most essential insights and is used to provide high-level updates for customers. This template includes tips and tricks for creating a QBR one-pager, as well as a QBR one-pager example from a fictional company called SimpleTicket. Use this template to update your existing QBR one-pager or start a new one from scratch.
Data-driven QBRs are essential resources for proving product value and retaining customers, but they can also be time-consuming to create. That’s why teams are using Matik to automate the creation of personalized, data-driven QBR decks and one-pagers for their customers.
With Matik, all you have to do is provide Matik with a few inputs (like account name and time range), and Matik will query the data to create a Google Slides or Microsoft PowerPoint deck with personalized text, images, charts, and tables.
.avif)