Successful businesses use data to inform decisions. But raw data without context can be overwhelming and confusing, which poses an obstacle when trying to take action based on data. Stories, on the other hand, are easy to follow and often contain insights that can influence actions. Data-driven storytelling is just what it sounds like: it takes data and transforms it into easy-to-understand stories. When data is presented without context it loses its meaning. Telling a story with data contextualizes the numbers so that they resonate with the audience.
Your copy is on the way to your email!
Oops! Something went wrong while submitting the form.
01
What is data-driven storytelling?
Successful businesses use data to inform decisions. But raw data without context can be overwhelming and confusing, which poses an obstacle when trying to take action based on data. Stories, on the other hand, are easy to follow and often contain insights that can influence actions.
Data-driven storytelling is just what it sounds like:it takes data and transforms it into easy-to-understand stories. When data is presented without context it loses its meaning. Telling a story with data contextualizes the numbers so that they resonate with the audience.Stories, on the other hand, are easy to follow.
It also makes the data easier to remember: according to research from a Stanford professor, when students are asked to recall a speech, 63% remember stories and only 5% remember statistics.
Stories make data easier to digest and data, in turn, give stories credibility. A compelling narrative that’s supported by contextualized data helps guide people to the next action they should take and can propel a business forward.
Why is data-driven storytelling important?
Using data-driven storytelling in your Customer Success strategy and practices is essential for the future success of your business. As the SaaS industry continues to evolve, customers are becoming savvier than ever.
This means two things for Customer Success teams:
Customers are no longer easily swayed by unsubstantiated claims, which makes data an essential part of every touchpoint, check-in, and renewal conversation.
Customers don’t have patience for wading through hard-to-understand raw data. They want a quick summary of how their company or team is using a product, and they want that summary to be supported by numbers.
Fortunately, those are the the exact needs that data-driven storytelling addresses.
Examples of effective data-driven storytelling
Spotify Wrapped is a popular and effective data-driven storytelling campaign.
Create customer connections with data driven storytelling
The first step in creating data-driven stories to achieve your business goals requires getting inside your customers’ heads. Before you can tell a story that will resonate with a customer, you must first understand their objectives.
"Make your customer feel seen and give them confidence in your credibility. Show your customer that your product plays a role in achieving their business goals."
Based on these objectives, you can select the data that would mean the most to them and craft a narrative that makes that data easy to understand. A personalized data-driven story makes your customer feel seen, gives them confidence in your credibility, and guides their next steps. An effective data-driven story will show your customer that your product plays an essential role in achieving their business goals.
For example, say you are selling a support ticketing platform and your customer’s goal is decreasing the time it takes to resolve a ticket. If your CSM simply tells your customer that the platform is being used regularly, your customer is not compelled to renew.However, if you can show your customer the average resolution time for last month vs. this month, the value of your product becomes undeniable.
03
What data do customers actually care about?
The data that your customers care about largely depends on each individual customer’s goals. That being said, here are some meaningful types of metrics that typically feature in data-driven stories:
Who is using the product and how often These metrics highlight who is taking advantage of the product, including how many people in the company are logging in, how often they are using it, who the top users are, and if there are specific teams or segments of the company using the product more than others.
How they are using the product These metrics highlight the parts of the product that are being taken advantage of, including the top features being used. They can also touch on underutilized features, since customers want to know if they are using a product to its full capacity.
The value of using the product These metrics highlight the value the customer is getting from the product. How to measure ROI will depend on the customer and their objectives. Examples include money earned or time saved thanks to your product.
04
How to transform data into insights
As we’ve mentioned, raw data can be challenging to action. But when data become insights, the value of the data becomes clear. Unlike numbers just by themselves, insights help customers understand what to do next, both in regards to your product and their business.
Data-driven stories serve as a vehicle for transforming data into insights. To turn data into insights, you must ensure that you are measuring data that is meaningful to your customers. This means that you are telling stories with data that align to your customers’ goals.
Once you have identified the right data, use the patterns that you see to craft a narrative. These patterns will not only shape your data-driven stories, but will also lead to recommendations for next steps. Supporting your insights and recommendations with data visualizations will make them even more powerful.
05
Data Visualizations 101
Data visualizations are the presentation of data in a graphic format. Think of them as the illustrations that accompany your data-driven story. Data visualizations are valuable storytelling tools because they help the customer quickly comprehend information and reveal patterns in the data.
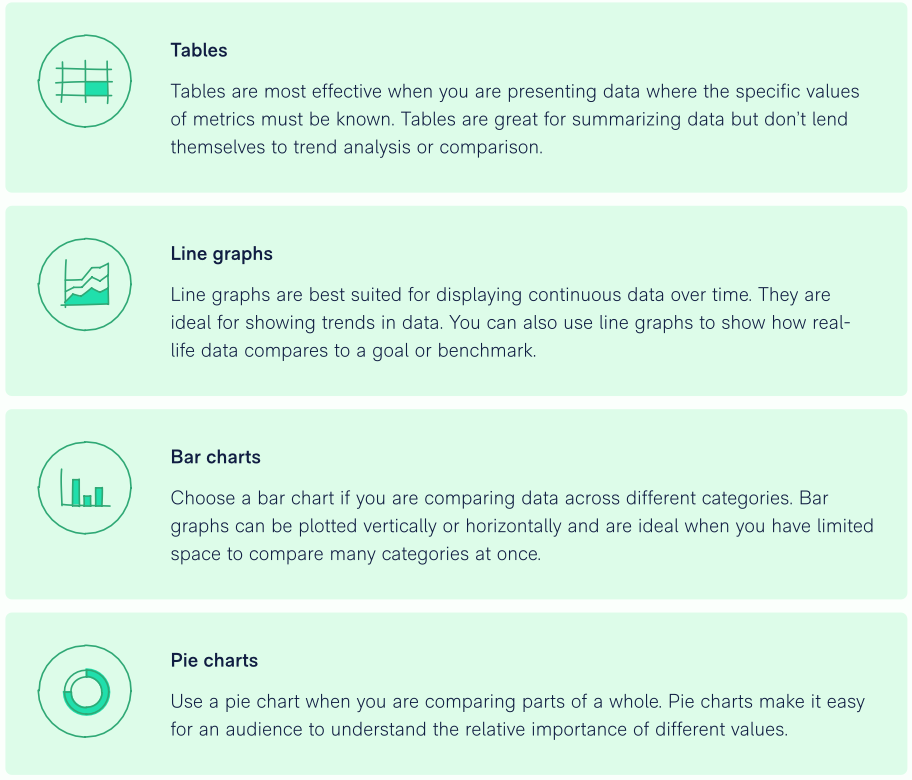
Effective data visualizations don’t have to be complicated: in fact, traditional bar graphs, line graphs, and pie charts are extremely effective forms of data visualization. Complicated data maps can be cool, but when choosing a visualization, you should always prioritize audience comprehension over a flashy graphic.
How to choose the right data visualization
When selecting a data visualization to support your data-driven story, you want to choose a visualization that will best help your customer quickly and easily comprehend the data. Simple is often best, which means you will likely be choosing between one of these four common visualization types:
06
Breathe life into QBRs with data-driven storytelling
Quarterly business reviews (QBRs) are a chance to put your data-driven storytelling skills to work. Successful QBRs foster relationships with your customer, illustrate the value of your product, and secure a renewal. Here are the key ways to create a winning data-driven QBR:
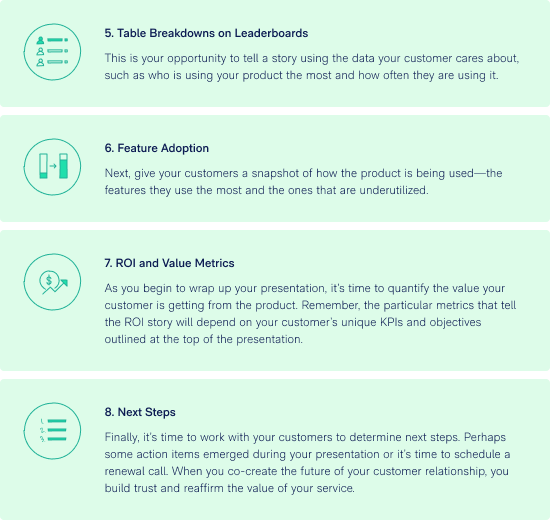
1.Reiterate partnership objectives and metrics You likely defined goals and objectives at a kickoff call with the customer. Use a data-driven story to show how your product has been used to achieve these objectives over the last quarter.
2.Highlight current success and future recommendations This will be the bulk of your meeting, but remember not to get into the weeds. Drive the conversation forward with key insights. Too much data and the conversation lacks focus; too little data and you won't convince them of the success to date.
3.Agree on next steps and set up a renewal conversation Setting clear dates and milestones will align stakeholders on plans moving forward. It also builds trust with the customer because it shows that you understand what they need to do to continue to see value from your product or service.
How to structure engaging QBRs
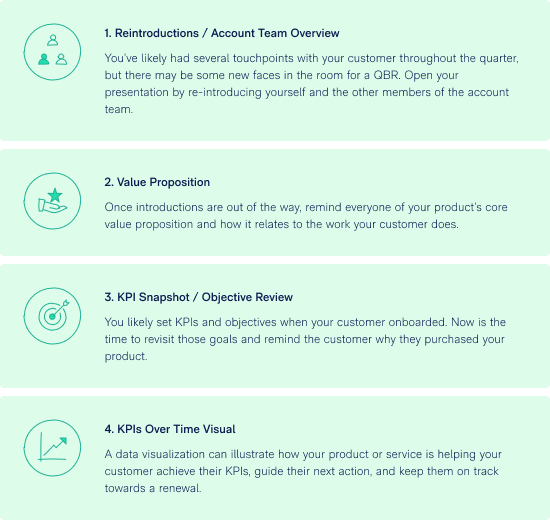
When it comes to the nuts and bolts of creating an engaging QBR, here’s an example of how to structure your presentation:
07
How to keep data-driven storytelling up-to-date
Meaningful data is always changing. As a result, data-driven stories are not static entities. Rather, they evolve as new data and information come to light. Customer Success Managers are constantly learning new information about their accounts, and these updates should translate into the data-driven stories they tell.
Updating Data-Driven Content Process
Have an idea for a new data point
Identify a new relevant data point that could enhance the story.
Put in request for creating data point
Submit a request to the data team to create and track this data point.
Add data point to your template
Incorporate the new data point into your existing data-driven content templates.
Get sign-off from marketing & ops
Ensure that the new data point and its presentation are approved by marketing and operations teams.
Pull data point every time you create content for a different customer
Regularly update the data point for each customer-specific content creation.
Creating Data-Driven Content Process
Put in request for data for specific customer
Request the latest data relevant to a specific customer from the data team.
Get data visualizations from team or screenshot from dashboard
Obtain data visualizations from the data team or capture screenshots from dashboards.
Add to deck and check deck to make sure data is correct
Insert the data into the presentation deck and verify its accuracy.
Share content with customer
Present the updated content to the customer.
In light of this regular influx of new data, the challenge becomes how to keep data-driven stories up-to-date. Unfortunately, for most companies, the answer is not straightforward. Ensuring that your team has the latest data to inform their customer narratives typically requires a close partnership with your data team. And even once that partnership is established, individual Customer Success Managers may need support turning raw data into insights that will resonate with their accounts.
08
It’s time to move beyond traditional ways of pulling data
In order to support your CSMs in telling data-driven stories that are personalized, relevant, and up-to-date, it’s time to move beyond traditional ways of pulling data.
Data teams (or, in the case of some start-ups, a single data analyst) are responsible for data maintenance and analysis for an entire company. Understandably, they may not have the bandwidth to regularly pull reports—and help interpret them—for CSMs.
Since fresh data is necessary if you want to tell effective data-driven stories, the burden of pulling this data can’t fall on the data team alone. Instead, find a partner who can automate the process of surfacing relevant account data and translating it into meaningful insights.
This way, even CSMs whose strength is not data analysis can become masterful data-driven storytellers, forge lasting customer relationships, and ensure the long-term success of your business.
Partner with Matik and tell powerful data-driven stories
Matik helps Customer Success and Sales teams automate the creation of compelling and personalized data-driven stories.
Empower your Customer Success and Account Managers to easily pull personalized metrics, text, tables, charts, and images into presentations, so that they can spend more time connecting with customers and winning deals.
.avif)