Automate text, visuals, and key insights in Financial Reports - telling the right story using if-then logic and your existing data.

Always have up-to-date metrics at your fingertips for weekly, monthly, or quarterly team meetings.

Create personalized presentations, documents, and reports that showcase value and drive outcomes.

Standardize documents, spreadsheets, and emails that keep teems informed and aligned.


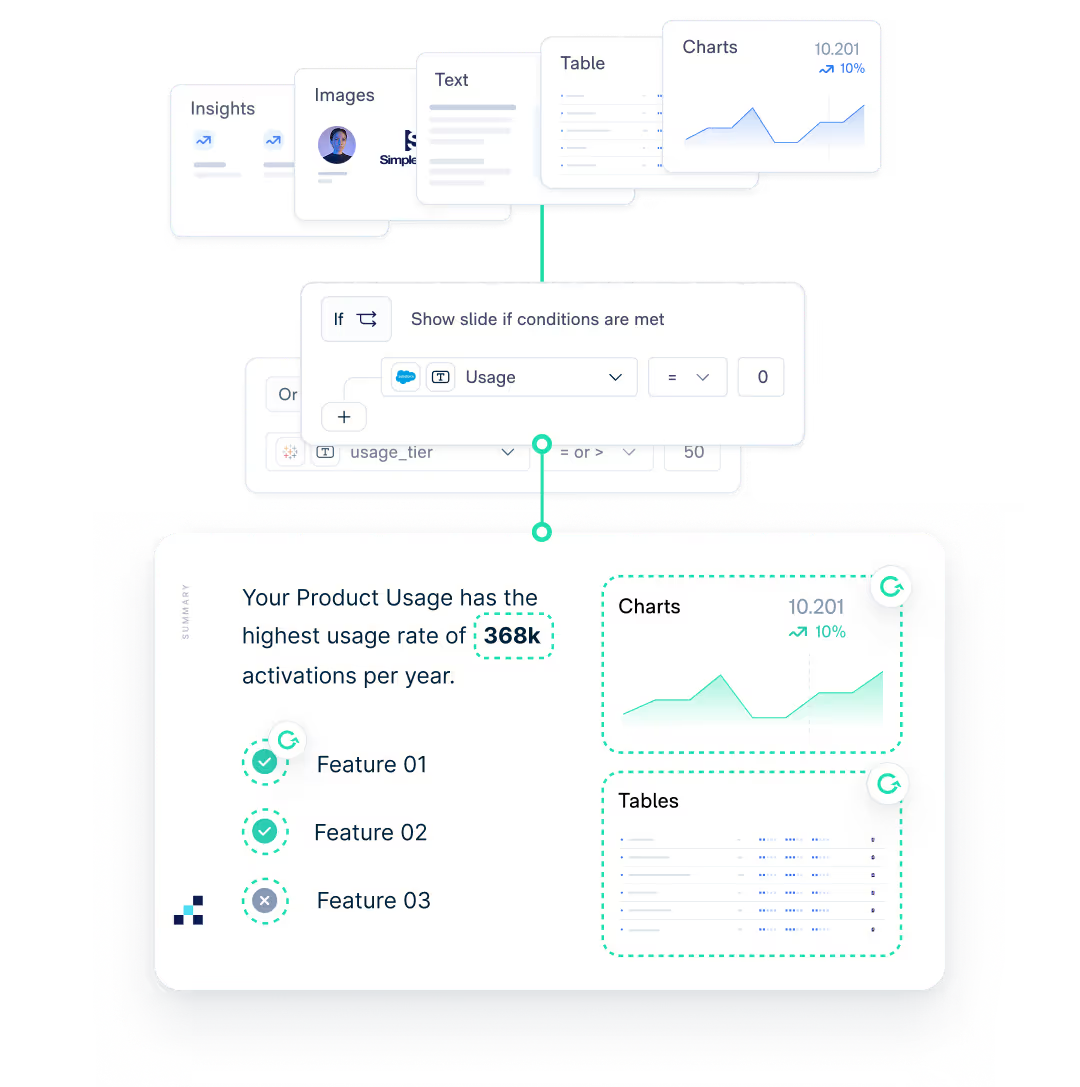
Automate text, visuals, and key insights in your Financial Reports - telling the right story using if-then logic and your existing data.


Enable confident data storytelling for everyone - ensuring every Financial Report follows best practices and uses accurate, reliable data.

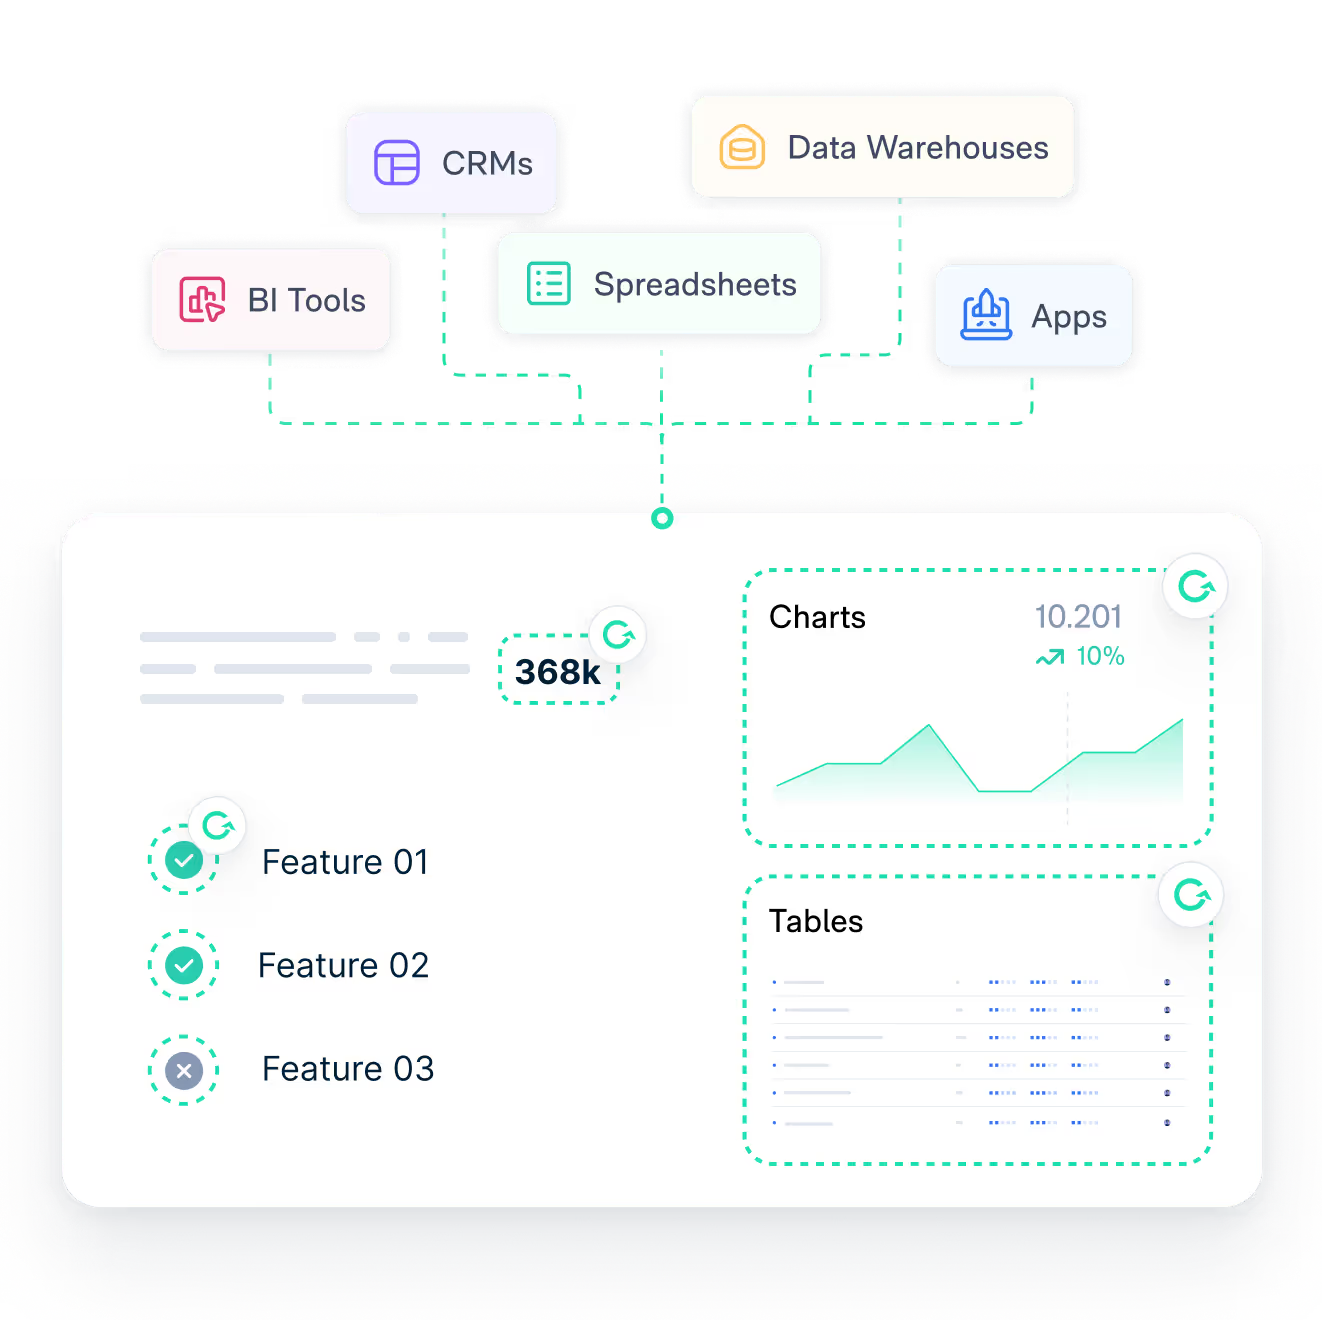
Matik connects directly to your data sources and automates Financial Reports in Google Sheets, Microsoft Excel, and other fully-editable formats. It automatically generates text, visuals, and key insights, turning raw data into polished, personalized presentations.
Yes, Matik uses if-then logic to personalize Financial Reports for every audience. Just tell Matik who the report is for, such as executives, customers, or internal teams, and Matik ensures each report includes the right metrics, visuals, and insights tailored to that stakeholder.
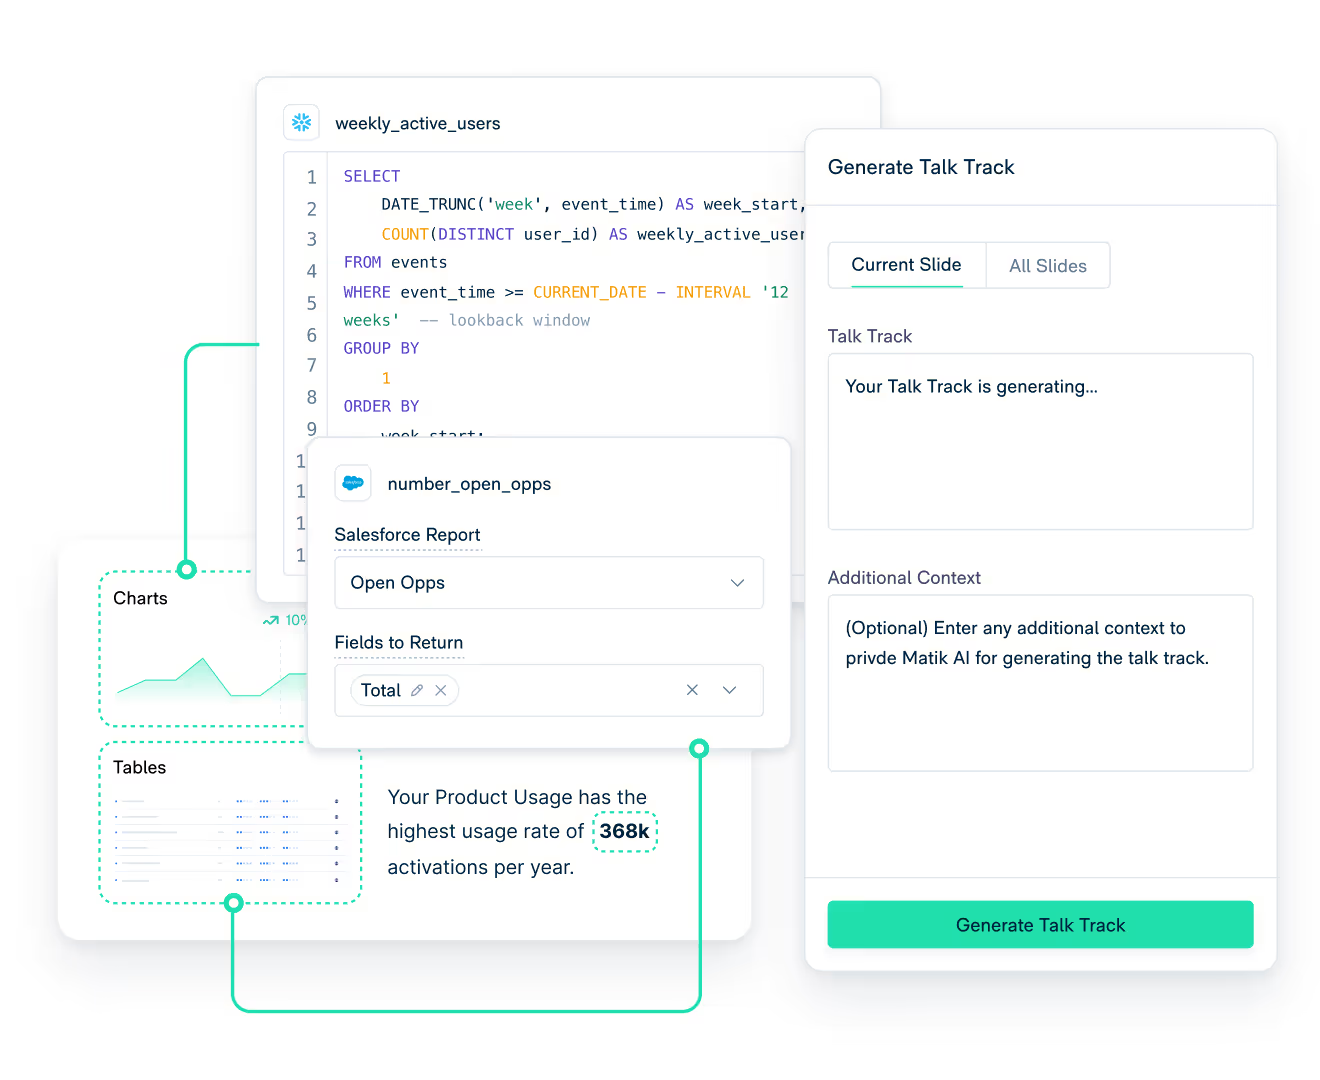
Yes, Matik’s AI transforms raw data into actionable insights within your Financial Reports. It can generate key summaries, next steps, analyze charts and tables, and other insights to make your content more impactful.
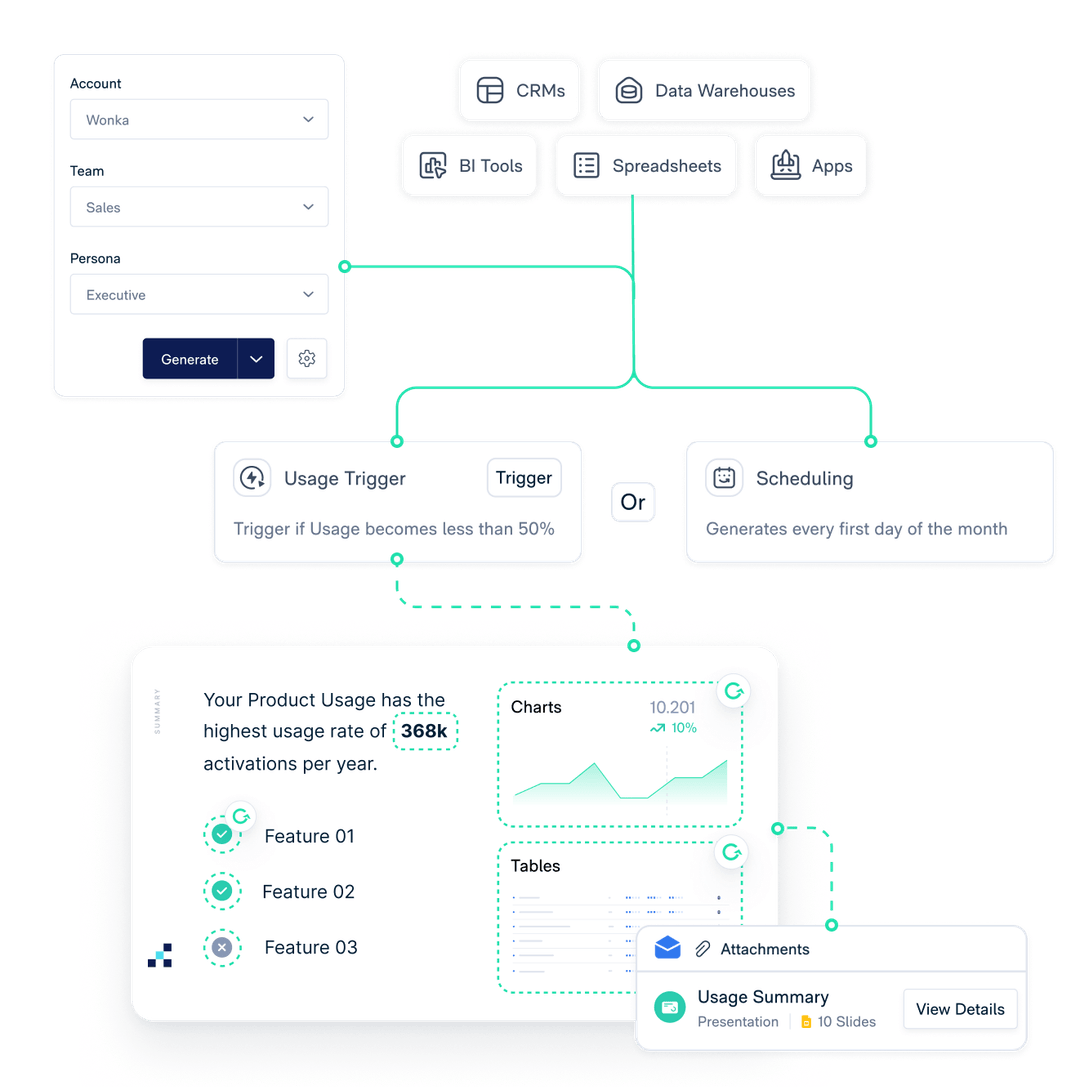
Absolutely. Matik can bulk-generate or trigger the creation of multiple Financial Reports at the same time. This lets teams instantly deliver personalized presentations at scale while ensuring accuracy, consistency, and time savings across every version.